
This brief examines the Prioritization dimension, including organizational trends, differences in how leaders and teams perceive Prioritization, recurring patterns, and implications for leadership.
What Is Prioritization, and Why Does It Matter to Agility?
Prioritization refers to the organizational alignment that exists around a consistent vision and strategy (e.g., Northstar) and how that vision cascades into teams and their work efforts.
Prioritization is not just about having individual goals for each team and executing against those goals, but rather having goals that are aligned and integrated up and down the organization, working in unison towards a single organizational vision. The power of prioritization is aligning finite resources and time, in an integrated and orchestrated fashion, to maximize value creation for the organization.
Based on our data, a major takeaway across organizations is that strong strategic vision does not, on its own, translate into effective work reprioritization.
Setting direction seems to be the easier part of the equation: organizations across our data are proficient at building a vision and translating it into a backlog. Re-ranking that work as conditions change is where the difficulty emerges, and it is where the data shows the widest gap between what organizations do well and what breaks down.
That contrast shows up clearly across the five performance areas the Agile Health Assessment measures: Customer Centricity, Prioritization, Culture & Mindset, Organizational Optimization, and Delivery.
Unlike the other four dimensions, Prioritization is neither uniformly strong nor uniformly weak; it is polarized. It holds both the strongest and the weakest indicators in the assessment, and it is the second most common weakest dimension (30.6% of organizations), behind only Organizational Optimization (42.9%).
What Are the Prioritization Sub-Dimensions?
To truly understand how prioritization shows up in an organization, we’ve broken this dimension down into four sub-dimensions:
- Vision-to-Backlog Alignment– How effectively is a vision translated into a backlog?
- Strategic Vision– Does an organization establish a strategic vision and build alignment around that vision?
- Work Prioritization– Does the organization effectively prioritize work on an appropriate daily/weekly/monthly/quarterly cadence?
- Need-Based Reprioritization– Does work get effectively reprioritized in response to market or organizational shifts?
Vision-to-Backlog Alignment and Strategic Vision are effectively tied at the top of all 19 indicators in the model, the healthiest top-of-funnel result of any dimension measured.
Need-Based Reprioritization, the ability to re-rank work as conditions change, ranks 19th, dead last. The same dimension holds the best score and the worst score, an eighteen-rank spread and the widest gap between highest and lowest indicator of any of the five performance areas.
This gap demonstrates the tension inherent in an organization's ability to plan and adjust. Business agility and market responsiveness is a goal for any executive team, but our data shows that organizations struggle to harmonize across the prioritization lifecycle.
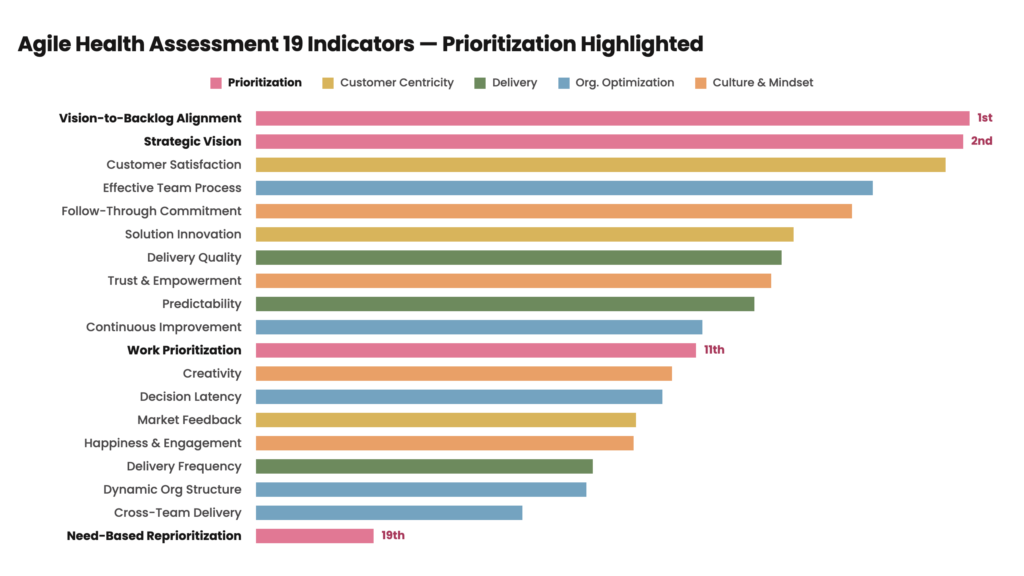
The pattern continues downward from there. Work Prioritization, the day-to-day act of choosing what to do next, sits at 11th, already a meaningful step down from the top-of-funnel indicators above it.
Setting direction is not the problem. What breaks down is ability to pivot and course correct a plan once it is set, and on that specific capability, no dimension in the model scores worse.
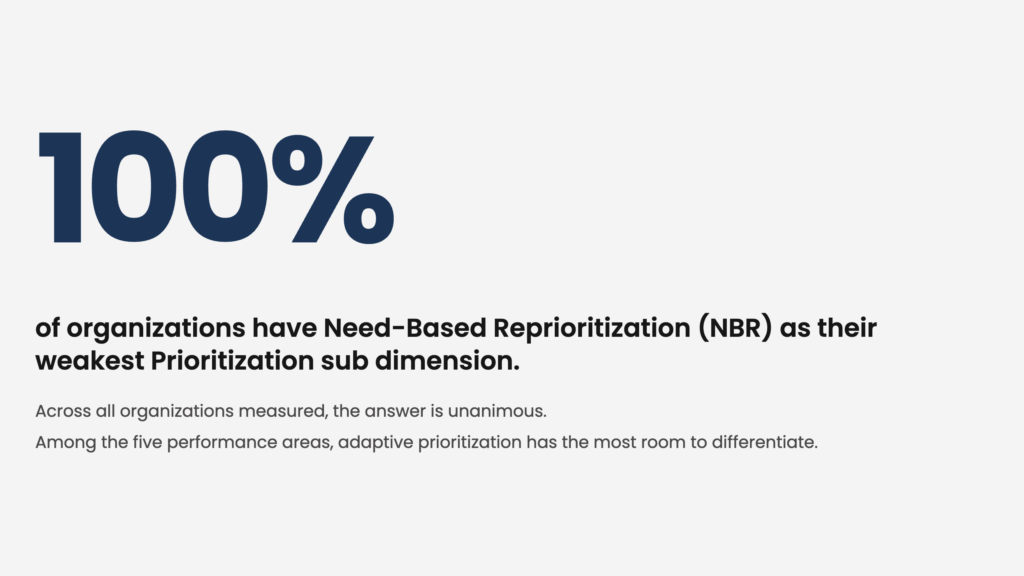
Need-Based Reprioritization is the lowest or joint-lowest Prioritization indicator in 100% of the organizations measured. A clear vision that does not adapt is a forecast, not a strategy.
Setting direction is not the problem. What breaks down is ability to pivot and course correct a plan once it is set, and on that specific capability, no dimension in the model scores worse.
What is the difference between Establishing Alignment vs. Maintaining it?
There is an important nuance to the strength of Vision-to-Backlog Alignment.
Our data shows that organizations report being effective at translating vision into a backlog. Our experience working directly with clients suggests that reported alignment does not always translate into shared choices across an organization regarding what to prioritize, how work fits together across teams, and what to stop.
This, paired with need-based reprioritization’s bottom ranking and differences in leader and team member scores (described below), shows that there is a difference between establishing that alignment and maintaining it as conditions change.
An organization may establish a vision, teams will go through the process of translating that into their backlogs, and consider the work aligned. But as new work is added, priorities shift, and market realities change, that backlog does not necessarily change in lockstep.
Work can accumulate without old work stopping, priorities can compete across teams or functions, and what teams are actually doing can begin to drift from the strategy the backlog was intended to support.
This does not contradict the strength of Vision-to-Backlog Alignment in the data. Instead, it offers an explanation for how Vision-to-Backlog Alignment can rank near the top while Need-Based Reprioritization ranks last. Organizations may be relatively strong at creating alignment at a point in time, but considerably weaker at maintaining that synchronization as reality changes.
How Do Leaders and Teams Perceive Prioritization Differently?
Perception adds another layer of evidence. Just over half of the organizations in the sample (52.6%) show misalignment between leaders and teams on Need-Based Reprioritization.
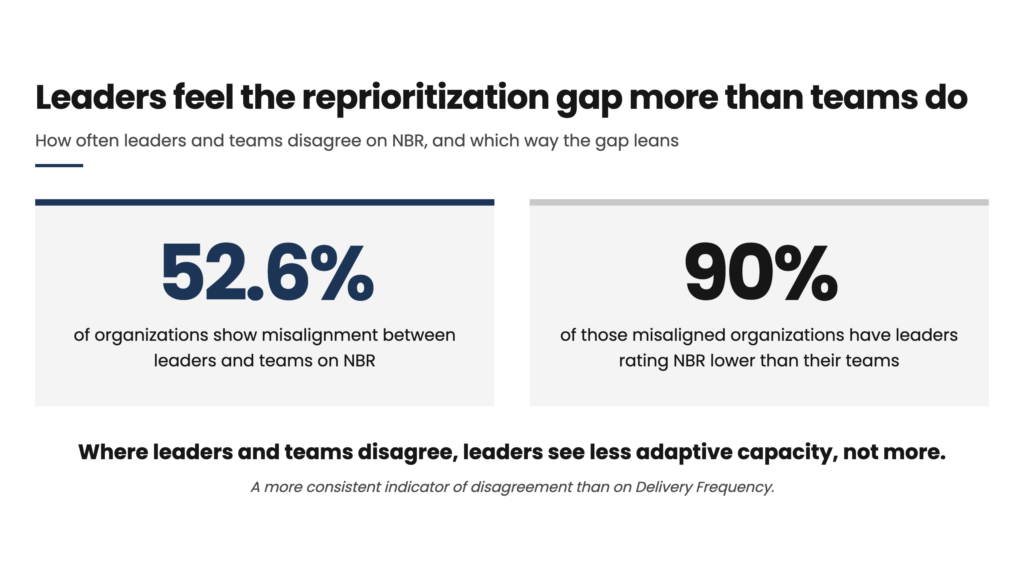
Where that misalignment exists, it leans sharply in one direction: 90% of the time, leaders rate reprioritization capability lower than their teams do, a more consistent indicator of disagreement than on Delivery Frequency (75%). The pattern is specific to reprioritization: on Prioritization as a whole, leaders rate lower in only 45% of misaligned organizations. These comparisons pool leader and team submissions from 2023 to 2026.
What Do the Findings Tell Us About Prioritization?
Based on our data, organizations report being much stronger at setting strategic direction and translating it into a backlog than they are at adjusting priorities as conditions change.
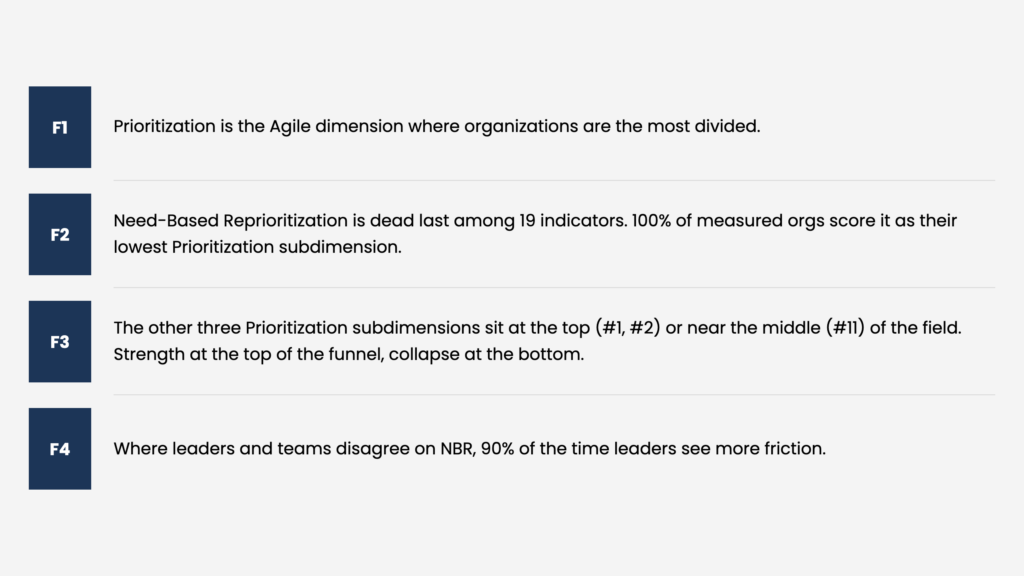
Vision-to-Backlog Alignment and Strategic Vision are tied at the top of all 19 indicators. Need-Based Reprioritization ranks last. It is the lowest or joint-lowest Prioritization indicator in 100% of organizations. And where leaders and teams disagree on it, leaders rate it lower 90% of the time.
None of these findings stand alone; each narrows the diagnosis further than the last. Prioritization is the Agile dimension where organizations are the most divided, holding the model’s best and worst indicators at once. Prioritization is strong at the top and the bottom seems to fall out when it becomes about reprioritizing. The real story is adaptation, not articulation. Organizations have an obvious opportunity to adjust, pivot, and flex based on needs. The opportunity exists to be agile with respect to strategy and prioritization.
What Patterns Emerge Across Organizations?
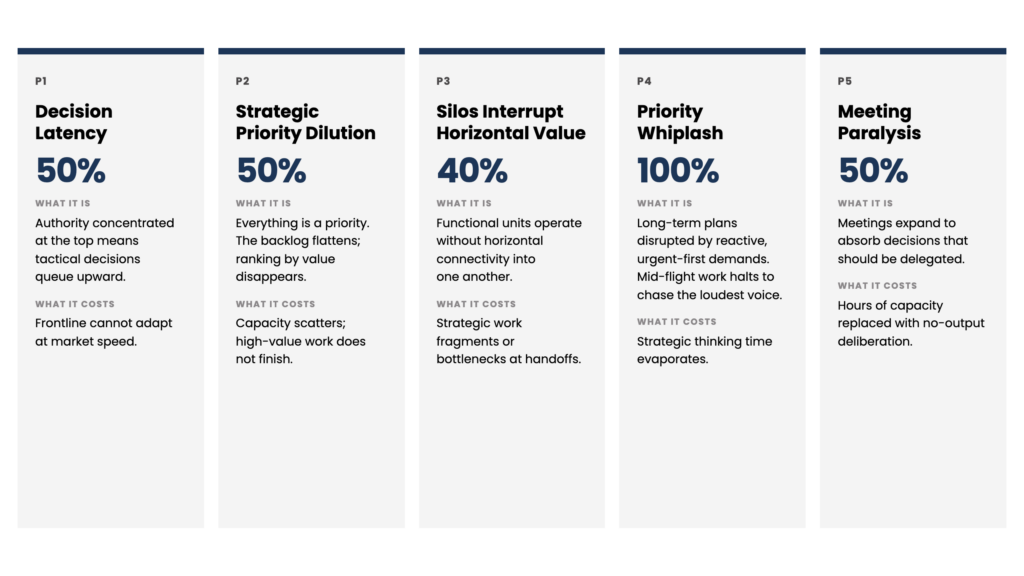
Five recurring patterns explain the adaptation breakdown, more than any other dimension in the model, and each has a distinct mechanism and a distinct cost.
Perception adds another layer of evidence. Just over half of the organizations in the sample (52.6%) show misalignment between leaders and teams on Need-Based Reprioritization. Where that misalignment exists, it leans sharply in one direction: 90% of the time, leaders rate reprioritization capability lower than their teams do, a more consistent indicator of disagreement than on Delivery Frequency
These patterns further explain the gap that exists between setting a vision and reprioritizing based on needs. Priority Whiplash is the most prevalent pattern in the entire dataset, appearing in 100 percent of organizations where due diligence and discovery interviews
What Separates Organizations with Stronger and Weaker Prioritization Scores?
For this analysis, organizations were grouped based specifically on their Prioiritization dimension scores, not their overall Agile Health Assessment performance. The clearest distinction between organizations within the top and bottom quartile of Priority scores is how they describe how prioritization happens.
Top-quartile organizations describe a cadence:
- “We re-rank quarterly.”
- “The roadmap is a working draft."
- “Owners change priorities.”
That language corresponds to reprioritization on a defined cadence, clear owners at every layer, strategic and tactical work prioritized together, and old work explicitly retired rather than left orphaned.
Lower-quartile organizations describe a freeze:
- “That was decided last year,"
- “Everything is a priority,”
- "We need [name] to weigh in.”
This language corresponds to priorities that are set but become harder to adjust as conditions change. New work accumulates without existing work being reconsidered, competing priorities persist, and reprioritization becomes reactive rather than part of how the organization routinely adapts.
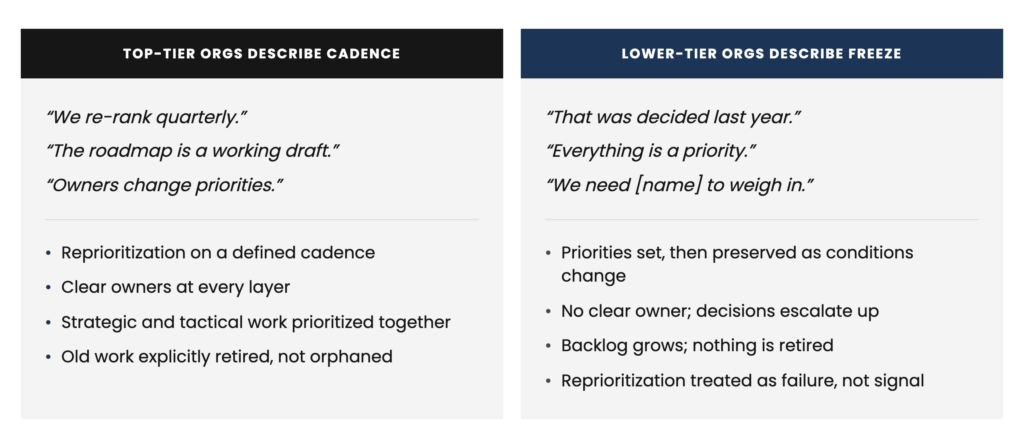
The issue is not whether priorities exist, but whether the system makes it possible to revisit them as new information emerges. Adaptation that depends on escalation or a single decision-maker is dependency, not organizational capability.
What Does This Mean for Leadership?
The data points to three main implications for leadership.
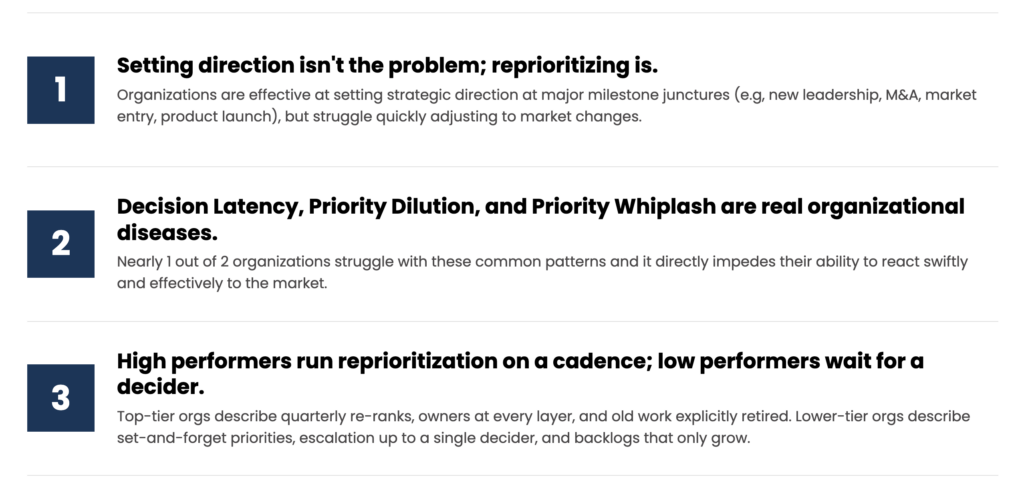
First, setting direction is not the problem; reprioritizing is. Organizations are effective at setting strategic direction at major milestone junctures, such as new leadership, M&A, market entry, or a product launch, but struggle to adjust quickly as market conditions shift in between those moments. For leaders, that means treating reprioritization as part of strategy, not a departure from it.
Second, Decision Latency, Strategic Priority Dilution, and Priority Whiplash are real organizational diseases, not minor friction. Nearly one out of two organizations struggle with the first two patterns, and all of them struggle with Priority Whiplash; together these patterns directly impede the ability to react swiftly and effectively to the market. Leadership should focus on the conditions that make it difficult for changing priorities to translate into changes in the work.
Third, high performers run reprioritization on a cadence; low performers wait for a decider. Top-tier organizations describe quarterly re-ranks, owners at every layer, and old work explicitly retired. Lower-tier organizations describe set-and-forget priorities, escalation up to a single decider, and backlogs that only grow. The leadership opportunity here is to build reprioritization into how the organization operates, so priorities can be revisited and adjusted as conditions change.
The goal is not simply to set the right priorities, but to build an organization that can continually revisit and adjust them as conditions change.
Summary
Prioritization is not uniformly strong or weak. It varies within and across organizations. It succeeds at the top of the funnel, setting vision and translating it into a backlog, and fails at the bottom, re-ranking that work as reality changes.
The result is the widest internal spread of any dimension in the model: the strongest indicator and the weakest indicator across all 19 dimensions both sit within Prioritization. Five interlocking patterns, most notably Priority Whiplash, Decision Latency, Priority Dilution, and Meeting Paralysis, explain why the ability to adapt remains weak even where planning is strong.
Leading organizations did not get there by setting better priorities. They built systems that could change their priorities when reality changed. They build agile organizations. That ability to adapt keeps strategy connected to changing conditions, helps organizations respond to the market, and directs resources towards the highest priorities. Setting strategy and reprioritizing as conditions change is where market leaders emerge, differentiation occurs, and value is created.