
This brief examines the Delivery dimension, including organizational trends, differences in how leaders and teams perceive Delivery, recurring patterns, and implications for leadership.
What Is Delivery, and Why Does It Matter to Agility?
Delivery refers to the outcomes that a team produces. Whether it is a physical product like a building or product, software, or a service – Delivery is the output that drives a team’s work effort. Teams organize around producing a defined “thing” for their external or internal customers. That “thing,” is how value is measured. Whether it is a part of a product or the sum of the product, Delivery is how a team produces value for its organization.
The overwhelming finding in our data is that delivery performance tracks operating-model design more closely than it tracks workforce commitment. Where delivery runs well, organizations share a common architecture: visible systems for completion, sequenced work rather than stacked demands, time-boxed commitments, distributed decision rights, and impediments treated as a routine queue rather than as exceptions.
Where delivery falters, the same kind of workforce operates without that architecture: completion becomes leader-dependent or improvised, demands stack rather than sequence, dates get negotiated rather than held, decisions escalate up the hierarchy, and recovery runs on individual effort rather than process.
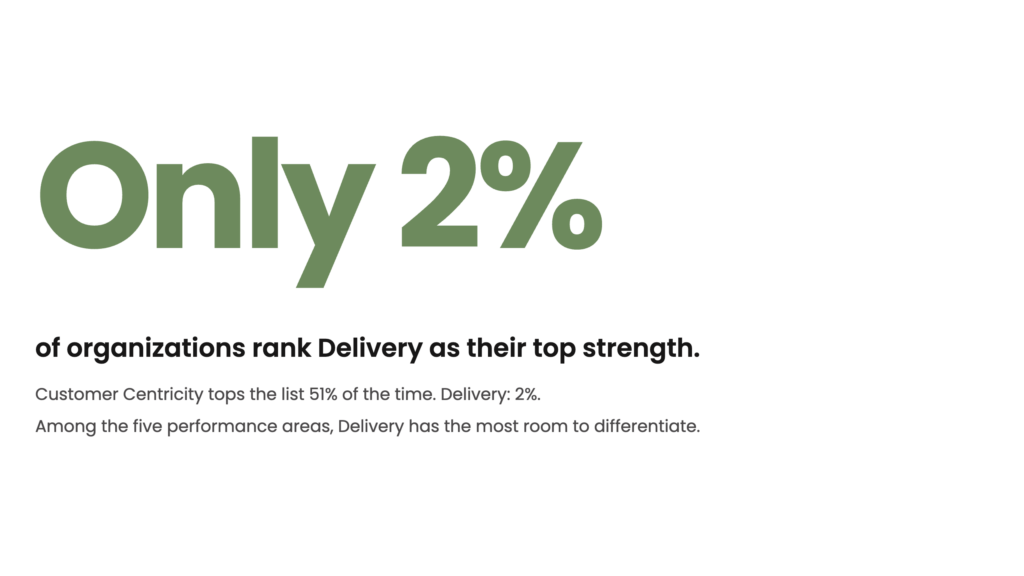
Delivery presents the clearest organization-wide opportunity for improvement across the assessment. Only 2% of organizations in the sample ranks Delivery as its top strength. Approximately 73.5 percent score Delivery below their own average across the other four dimensions, 81.6 percent place it among their bottom three, and 38.8 percent place it among their bottom two. This consistency points to a problem in the mechanics of how work moves through the organization, not a problem with workforce commitment or capability.
What Are the Three Delivery Sub-Dimensions?
To truly understand how an organization delivers, we’ve broken this dimension down into three sub-dimensions:
- Frequency – Is the frequency of product increments appropriate? Are teams following the appropriate cadence to deliver?
- Predictability – How predictably and reliably does the organization meet delivery expectations? What is the level of confidence in meeting established goals and deadlines?
- Quality – What is the quality of the work products delivered? Do outputs meet expected quality standards?
Delivery’s weakness is concentrated in Frequency rather than spread evenly across all three sub-dimensions. Sixty-eight percent of organizations rank Frequency as their lowest Delivery measure. While 80% of the lowest-scoring quarter rank Frequency lowest. The clearest opportunity is therefore not Delivery broadly, but the cadence at which organizations complete and release valuable work.
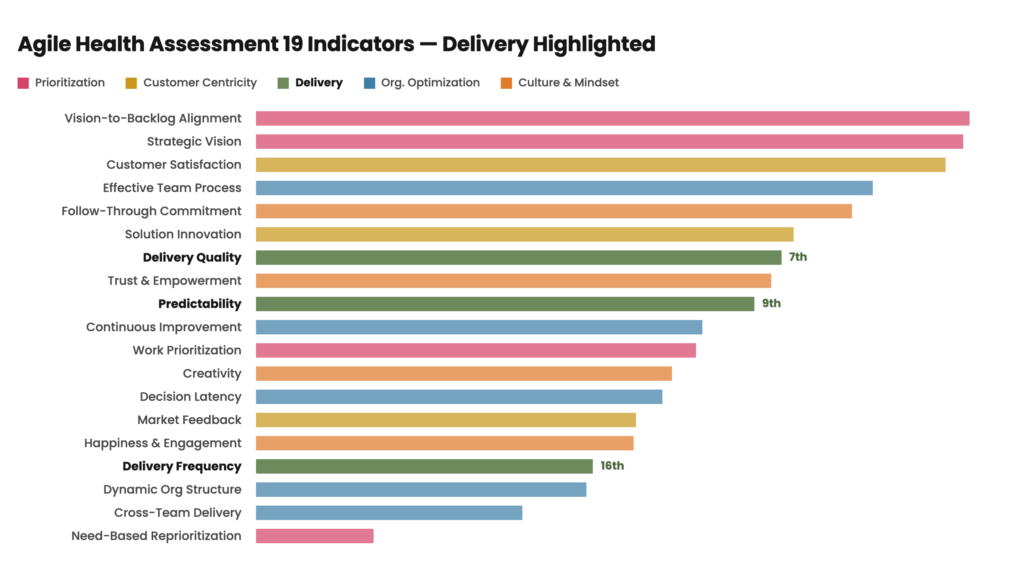
The severity for Frequency becomes even more clear when compared against the assessment's full set of indicators. Across all 19 sub-dimensions spanning all five performance areas, Delivery Quality ranks 7th and Predictability ranks 9th, both comfortably in the upper half. Delivery Frequency ranks 16th of 19, the fourth-worst indicator in the entire model; only three indicators in the Agile Health Assessment model, Dynamic Org Structure, Cross-Team Delivery, and Need-Based Reprioritization, score lower.
The Delivery problem, in other words, is not a broad quality issue. It is specifically a cadence problem, and it is one of the worst-performing measures the assessment tracks anywhere in the model.
Where delivery falters, the same kind of workforce operates without that architecture: completion becomes leader-dependent or improvised, demands stack rather than sequence, and recovery runs on individual effort rather than process.
How Do Leaders and Teams Perceive Delivery Differently?
Perception adds a second, independent layer of evidence. Across the dataset, 50% show a leader–team gap; where they differ, leaders rate Delivery lower 90% of the time.
That misalignment is informative on its own. It suggests leaders are frequently catching friction that teams have already absorbed as routine and normalized as par for the course. The challenges required to deliver no longer register to the people closest to the work as a problem worth flagging; those challenges are baked into how a team operates.
When a team is compensating for a broken cadence through personal effort, the team focuses on the outcome (e.g. the date was hit) while the leader senses the strain required to achieve that goal. The gap between leader and team perception should be read as signal, not noise, and the qualitative and quantitative evidence point in the same direction independently.
What Do the Findings Tell Us About Delivery?
Four findings converge on a more specific diagnosis than “Delivery is weak.”
First, Only 2% of organizations rank Delivery as their top strength. Second, Frequency is the lowest Delivery measure in 80 percent of organizations. Third, Frequency ranks 16th of all 19 assessment indicators, while Quality and Predictability rank considerably higher. Fourth, when leaders and teams disagree, leaders rate Delivery lower 83 percent of the time.
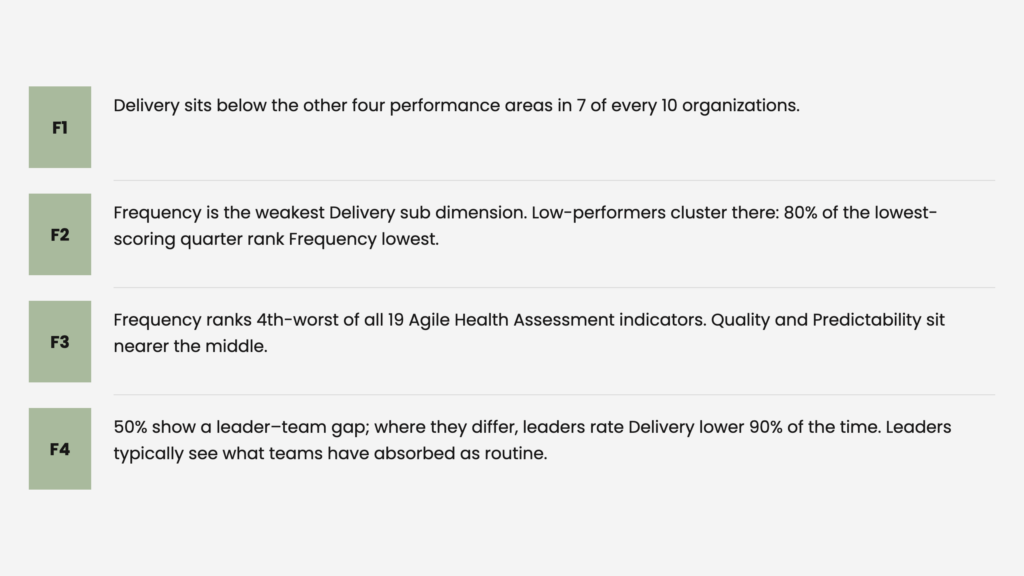
Together, these findings point to a cadence problem that can remain hidden when teams compensate through added effort. The principal opportunity is not improving Delivery broadly; it is creating a repeatable system for completing and releasing valuable work.
What Patterns Emerge Across Organizations?
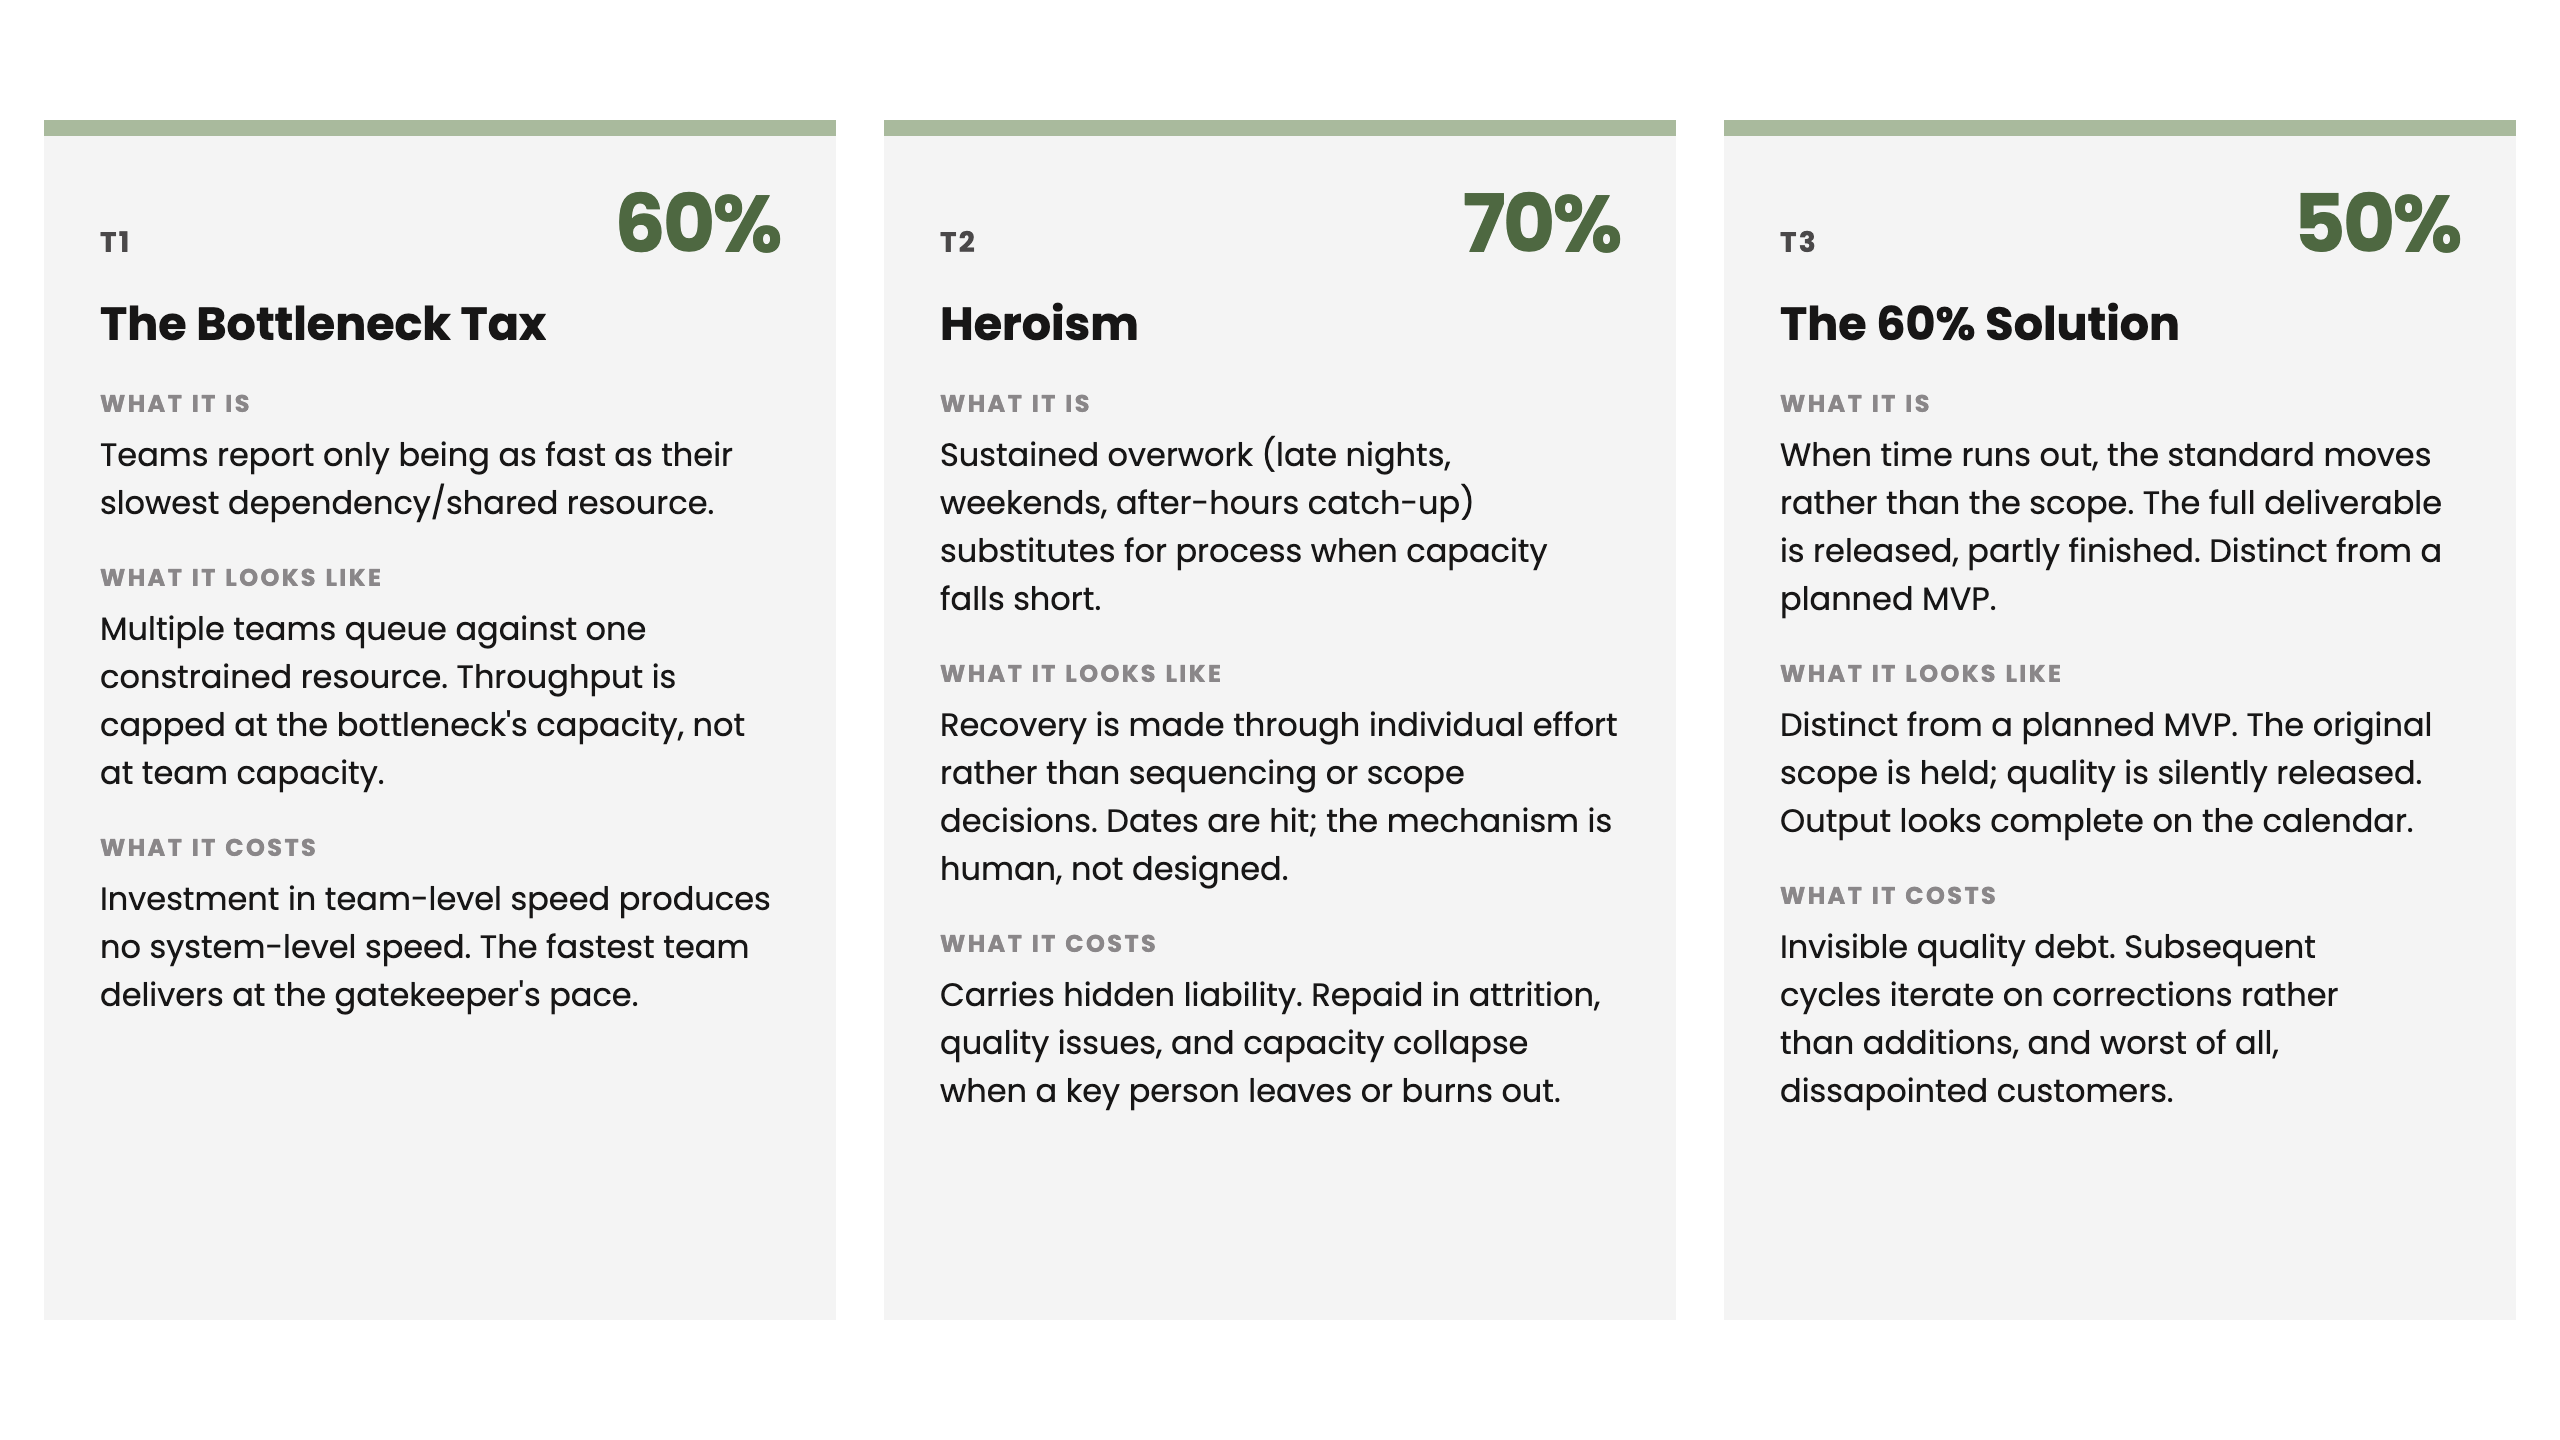
Three recurring patterns explain how the cadence problem appears in practice. The Bottleneck Tax slows work when decisions or specialized activities depend on a small number of people. Heroism substitutes extraordinary individual effort for reliable process. The “60% Solution” fragments attention across competing priorities, leaving work active but unfinished.
What Separates Organizations with Stronger and Weaker Delivery Scores?
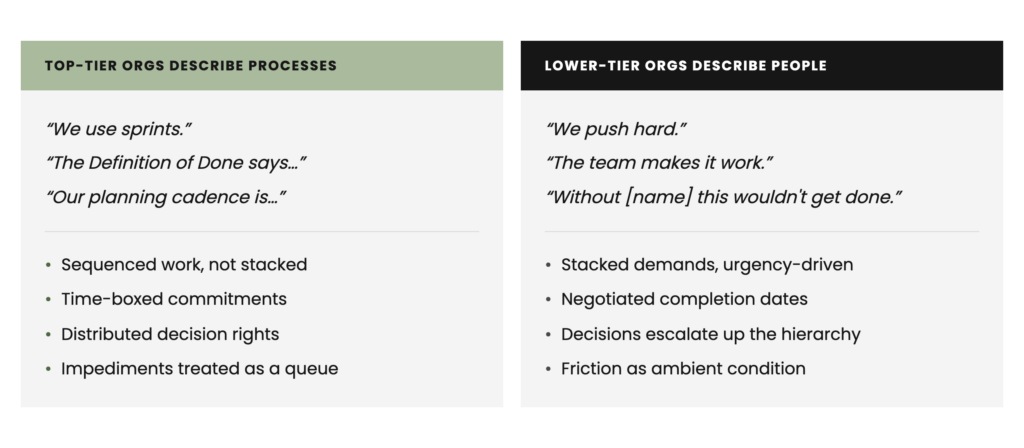
For this analysis, organizations were grouped based specifically on their Delivery dimension scores, not their overall Agile Health Assessment performance. The clearest distinction between organizations within the top and bottom quartile of Delivery scores is how they describe the way work reaches completion.
Top-quartile organizations describe processes:
- "We use sprints."
- "The Definition of Done says…"
- "Our planning cadence is…."
That language corresponds to sequenced work rather than stacked demands, time-boxed commitments, distributed decision rights, and impediments treated as a routine queue.
Lower-quartile organizations describe people:
- "We push hard."
- "The team makes it work."
- "Without [name], this wouldn't get done.”
In these instances, language corresponds to stacked, urgency-driven demands, negotiated completion dates, decisions that escalate up the hierarchy, and friction treated as an ambient condition rather than something to be resolved.
Performance that depends on named individuals is dependency, not capability, and it is fragile in exactly the ways the data shows: it does not show up as a strength in the aggregate, it concentrates in Frequency specifically, and it is often invisible to the people closest to it until a leader or an external assessment surfaces it.
What Does This Mean for Leadership?
Three implications are consistent across organizations, and each connects back to a specific finding rather than standing as general advice.
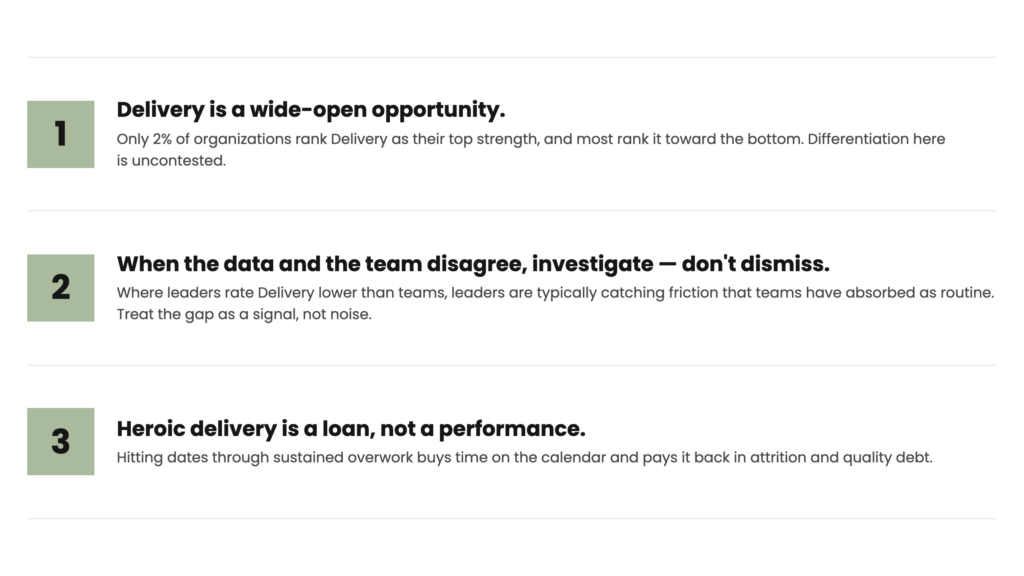
First, Delivery represents a wide-open opportunity. Without execution, there is no point and any strategy will be for not. Only 2% of organizations rank it as a top strength, and the sub-dimension data identifies a clear starting point: Frequency. Improving delivery cadence can help an organization respond to customers faster, reduce the effort required to meet commitments, and differentiate through more reliable execution.
Second, when survey results and team sentiment disagree on Delivery, that gap deserves investigation rather than dismissal. Especially, since leaders are typically the ones noticing friction that has become normalized at the team level. The 83 percent asymmetry makes this a reliable enough signal to act on rather than dismiss as noise.
Third, replace heroic delivery with repeatable systems. Heroism appears in 70 percent of organizations, making it the most common of the three patterns. Extraordinary effort may help teams meet a commitment, but it also creates dependency, exhaustion, and quality risk. Leaders should ask whether delivery success can be repeated without relying on the same individuals to continually compensate for weaknesses in the system.
The leadership question is not, “Did we hit the date?” It is, “Can our system deliver valuable work reliably without depending on extraordinary individual effort?”
Summary
Delivery is the one performance area Only 2% of organizations have made it a strength, and the weakness traces to a specific place: cadence, not quality or predictability.
It shows up consistently across three independent lines of evidence, the aggregate ranking against other performance areas, the indicator-level ranking against all 19 measures in the model, and the gap between what leaders and teams report, and all three point in the same direction.Three structural patterns, the Bottleneck Tax, Heroism, and the 60% Solution, explain much of why cadence breaks down, and the organizations that avoid them are not the ones asking more of their people.
They are the ones that built systems that need less heroism to produce more delivery. Focusing on the operating model to improve Delivery can lead to clear market differentiation. That market differentiation turns into customer value.