
In this brief we trace how Organizational Optimization compares to the other four agile dimensions and identify trends, perception differences between leaders and teams, patterns, and leadership implications.
What Is Organizational Optimization, and Why Does It Matter to Agility?
Organizational Optimization refers to the architecture and system in place to support coordination and execution within and across teams. When most people hear the term “organization” they almost always pivot to org charts, reporting lines, and hierarchy.
While this is certainly an element of Organizational Optimization, the focus of this dimension is more on how effectively the system supports rapid responses to customer opportunities (Customer Centricity), enables teams to produce intended outcomes (Delivery), and helps keep the organization aligned, from strategic priorities to the work being done (Prioritization).
Across our data, the greatest takeaway for Organizational Optimization is that it presents the greatest widespread relative weakness, or opportunity for improvement for organizations.
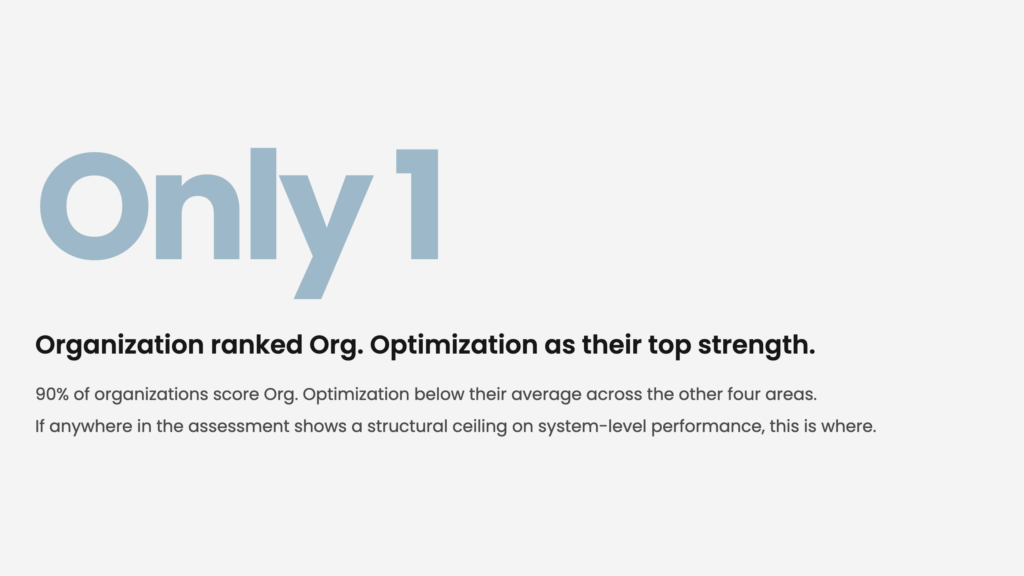
Ninety percent of organizations score this dimension below their own average across the other four areas, and only a single organization in the entire dataset has Organizational Optimization as its strongest dimension. If any part of this assessment shows a structural ceiling on system-level performance, this is it.
Put simply, our data indicates that process broadly works inside teams, but stalls between them. Effective Team Process ranks 4th of all 19 Agile Health Assessment indicators, the second-strongest non-Prioritization indicator in the model; inside a single team, organizations have learned to run a decent operating cadence. But Cross-Team Delivery (18th), Dynamic Org Structure (17th), and Decision Latency (13th) form the bottom of this dimension, and Cross-Team Delivery and Dynamic Org Structure account for two of the five lowest-ranked indicators in the entire model. The friction is between teams, not within them.
The Five Sub-Dimensions of Organizational Optimization
To understand how the system works, we have broken down Organizational Optimization into five sub-dimensions:
- Cross-Team Delivery and Communication – How well do teams coordinate dependencies and integrate their work? Does information move across teams quickly enough to surface and resolve impediments?
- Dynamic Organization Structure – Can the organization reconfigure teams and structures as priorities, products, or market conditions change? Are teams organized around value streams rather than functional silos?
- Decision Latency – How quickly are decisions made and are they made at the lowest appropriate level? How long does work wait on a decision before it can move forward?
- Effective Team Process – Do teams follow a consistent, disciplined process that supports focus, transparency, and a sustainable pace? Are roles, events, and artifacts used to maximize value creation?
- Continuous Improvement – Does the organization regularly inspect and adapt its ways of working? Are improvement actions identified, owned, and completed, and do they produce measurable results?
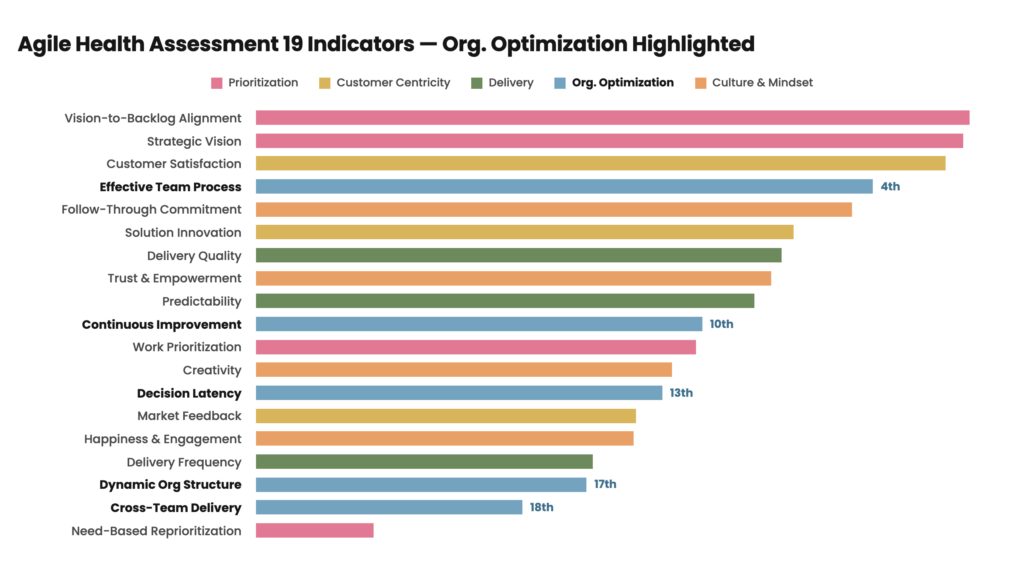
The internal spread inside this one dimension is the largest of any dimension in the model apart from Prioritization: fourteen ranks separate Effective Team Process (4th) from Cross-Team Delivery (18th), meaning the same dimension's best and worst sub-dimensions sit further apart than the top and bottom of most other dimensions combined. Dynamic Organization Structure and Cross-Team Delivery rank 17 and 18 respectively, giving this dimension 2 of the 3 weakest sub-dimensions in the entire model.
Individual team processes are mostly healthy; cross-team processes are not. The challenge comes in the dynamism and coordination of the system. The gap between individual teams and the system is not a rounding error, but a material gap.
How Do Leaders and Teams Perceive Organizational Optimization?
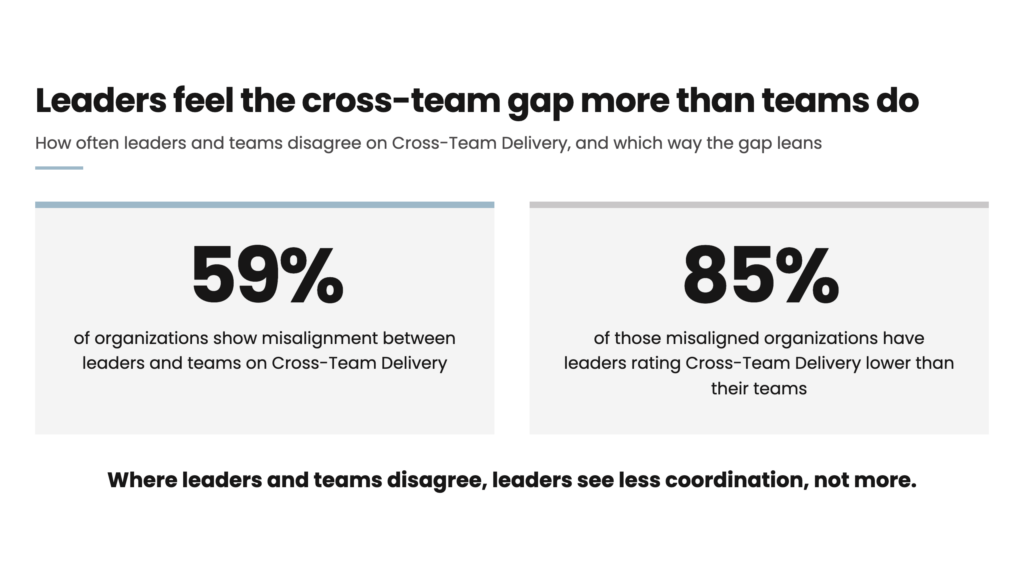
Perception adds another layer of evidence. More than half, 59 percent, of the organizations assessed for leader-team alignment on Cross-Team Delivery show misalignment. This is the highest misalignment rate among the five weakest sub-dimensions compared in the output and that gap is significant. 85 percent of those misaligned organizations have leaders rating Cross-Team Delivery lower than their teams do.
Leaders consistently see less effective coordination, not more. Cross-team friction may be the hardest failure mode for teams inside the system to see. From a team’s perspective, they may see strong team performance for themselves, and very likely perceive handoff issues as the result of someone else’s delays.
In other words, individual teams may see cross-team challenges as pointed problems, rather than the broader structural challenges embedded within the system. We see this challenge with many of our clients, where lack of clarity around a team’s objectives or roles blur responsibilities and touchpoints.
Another common system constraint we see with many organizations is the lack of formalized processes, cadence, and systems infrastructure (e.g. related and overlapping teams working together in portfolio or platform environments) to facilitate cross team structures.
Without the structures to coordinate dependencies, clarify responsibilities, and resolve impediments, strong team performance doesn't necessarily translate into organizational performance.
What Do the Findings Tell Us About Organizational Optimization?
Together, these four findings converge on a single structural diagnosis.
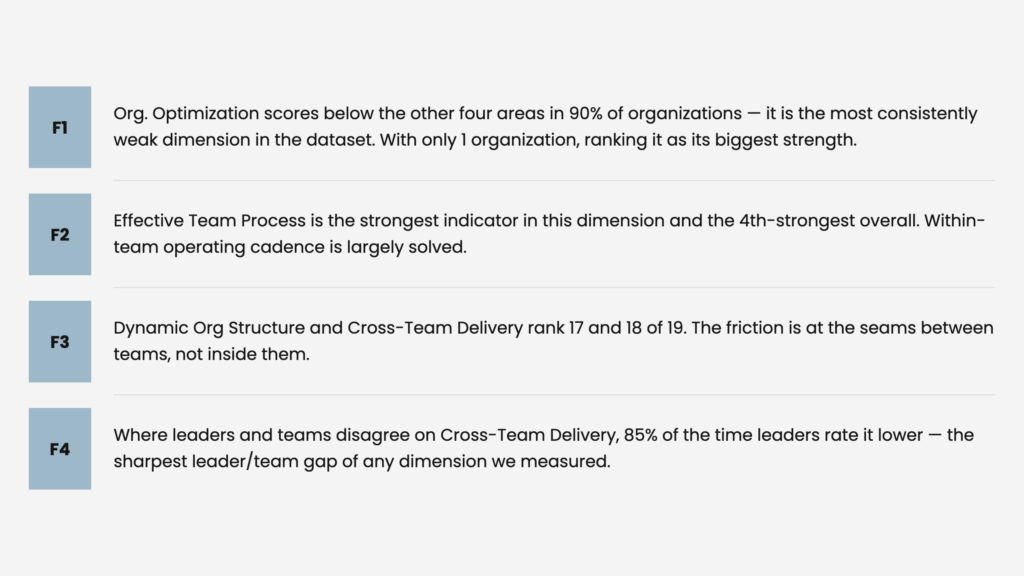
Organizational Optimization is the most consistently weak dimension in the model. While dynamics and performance within teams are strong, coordination and collaboration across teams need greater attention. Leaders recognize these challenges more often than team members..These four findings point to the lack of effective scaling structures and systems, suggesting that the greatest opportunity for improvement lies at the broader organizational level rather than within individual teams.
What Patterns Emerge From the Dataset?
Three qualitative patterns offer possible explanations for the cross-team challenges.
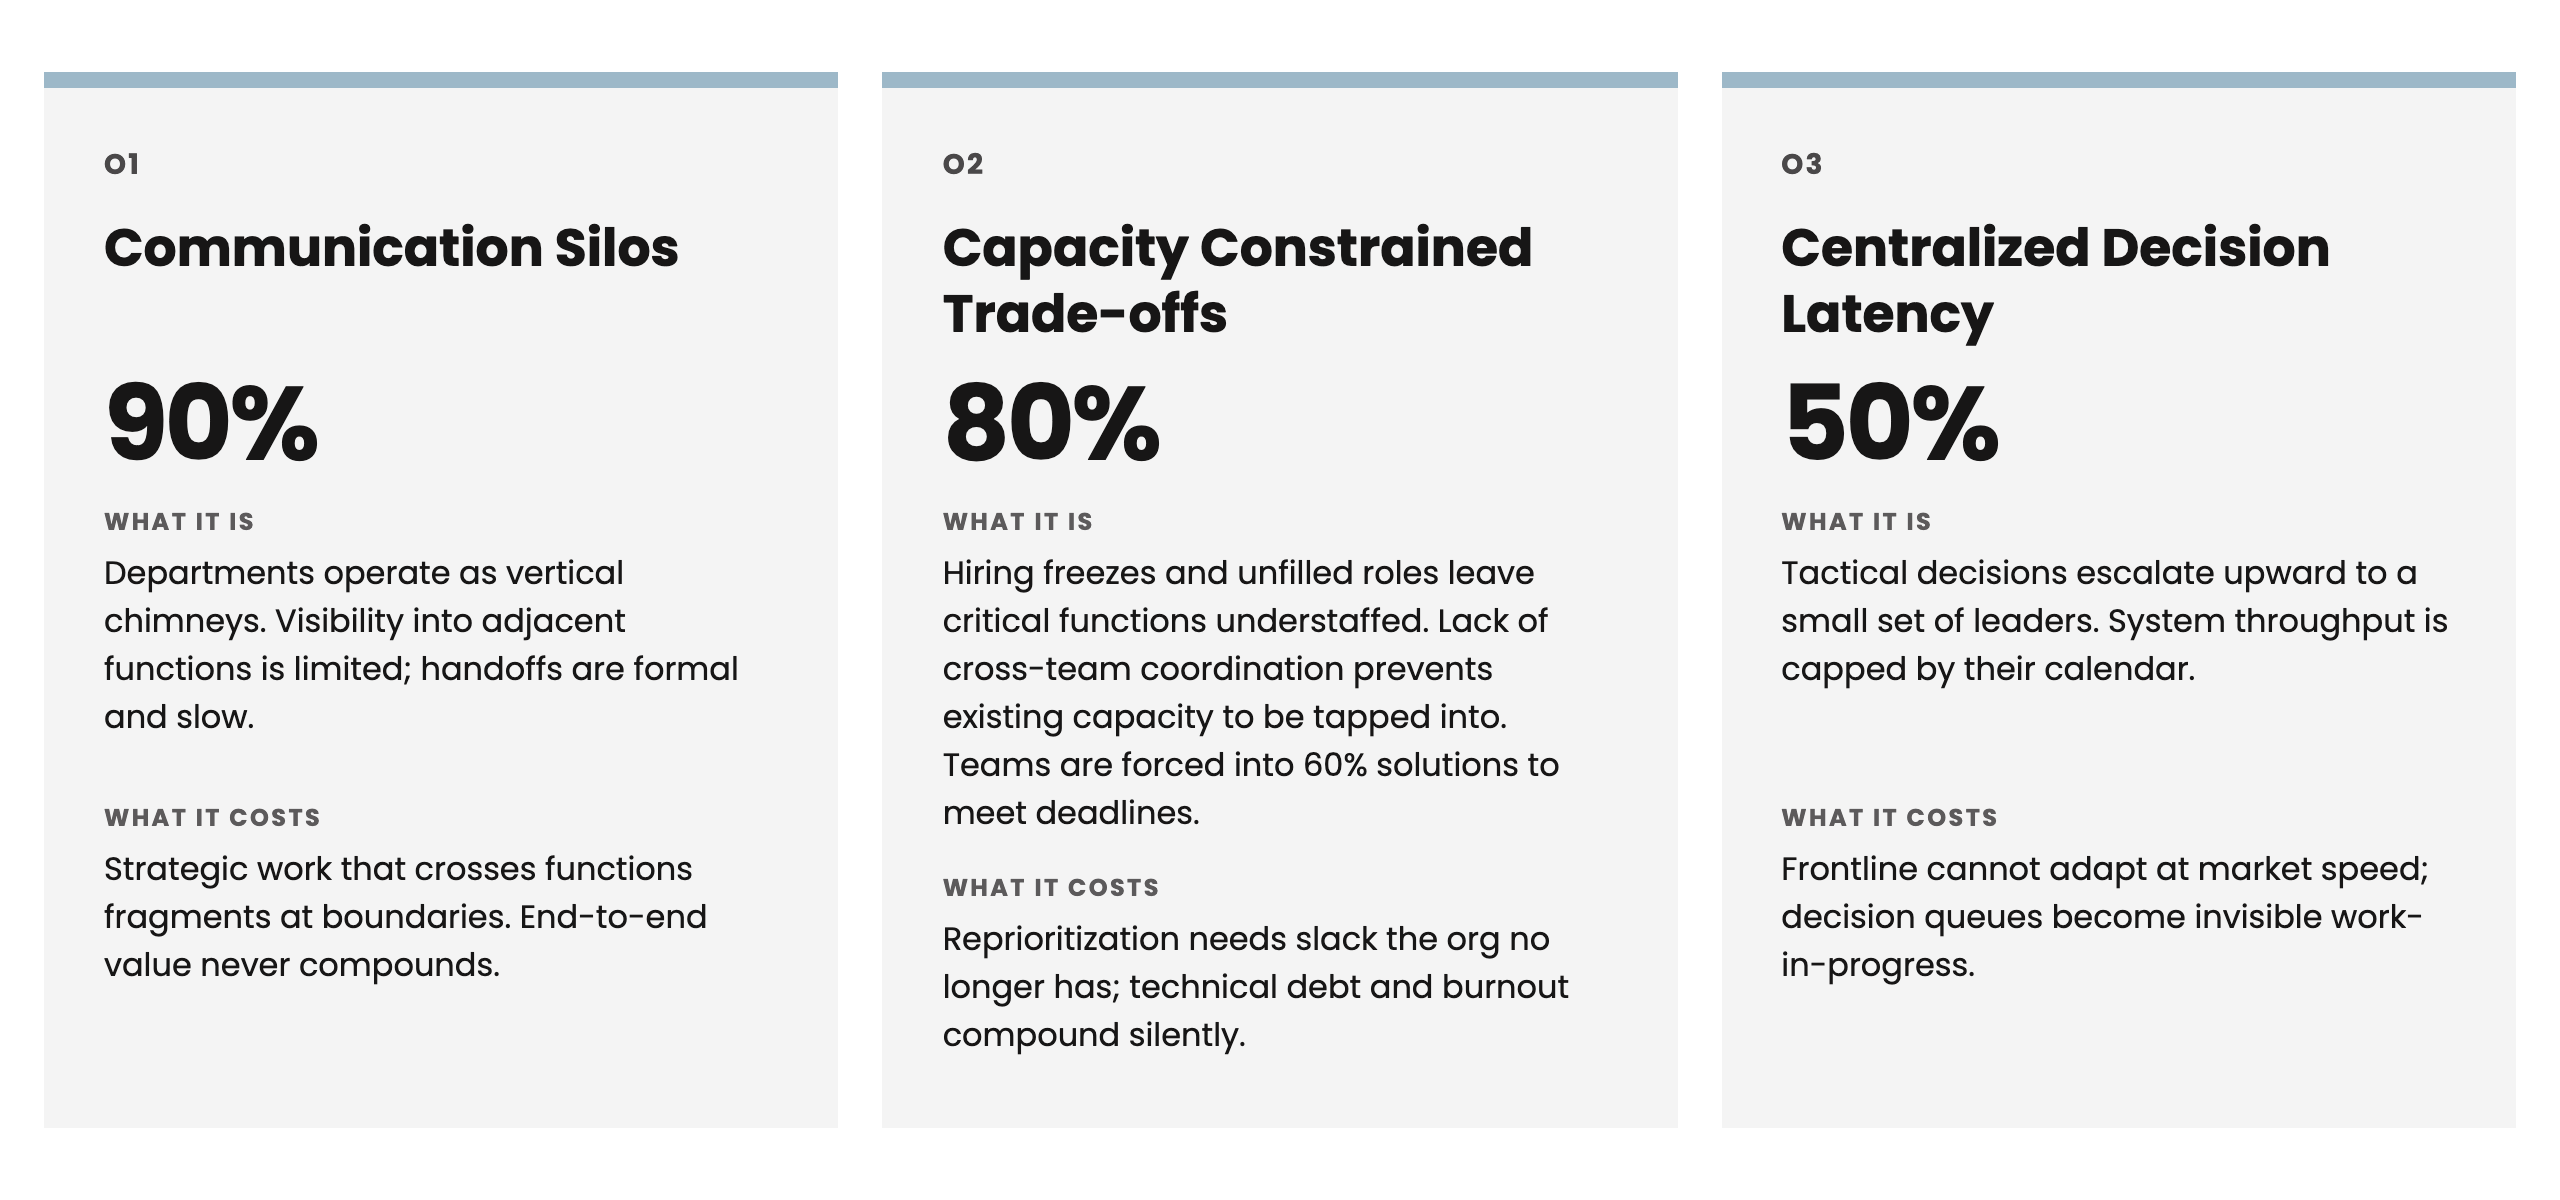
Communication Silos appear in 90 percent of organizations, a recurring challenge in the qualitative findings: department communication occurs up and down the vertical, usually within the function, but visibility across teams is limited. Cross-team handoffs are often formal and mired in bureaucracy and approvals as teams want to be careful of missteps and getting caught in the cross-fire of political battles.
Capacity Constrained Trade-offs appear in 80 percent of organizations. Again, the lack of cross-team coordination plays a role in constraining organizational outputs. Hiring freezes are common organizational obstacles, but agile organizations have the system to allow team reconfigurations or work re-routing to occur to tap into capacity where it exists. Where organizational silos prevent cross-team delivery, teams are forced to release products that are partially baked, the 60% Solution discussed in the Delivery dimension.
Centralized Decision Latency appears in 50 percent of organizations. Decisions escalate upward to a small set of leaders, and system throughput is capped by their calendar. The organization is constrained in its ability to respond at market speed. Decision making is hampered by bureaucracy and approvals. The system is not operating optimally.
These patterns interlock with the patterns found in Prioritization: decision latency and silos appear in both dimensions, suggesting a shared environment where Organizational Optimization and Prioritization operate in unison and impact each other.
What Separates Organizations with Stronger and Weaker Organizational Optimization Scores?
As we have done in previous briefs, we decomposed the dimension further by looking at what differentiates higher and lower performing organizations. Specifically, we looked at the language explicitly used to describe their Organizational Optimization.
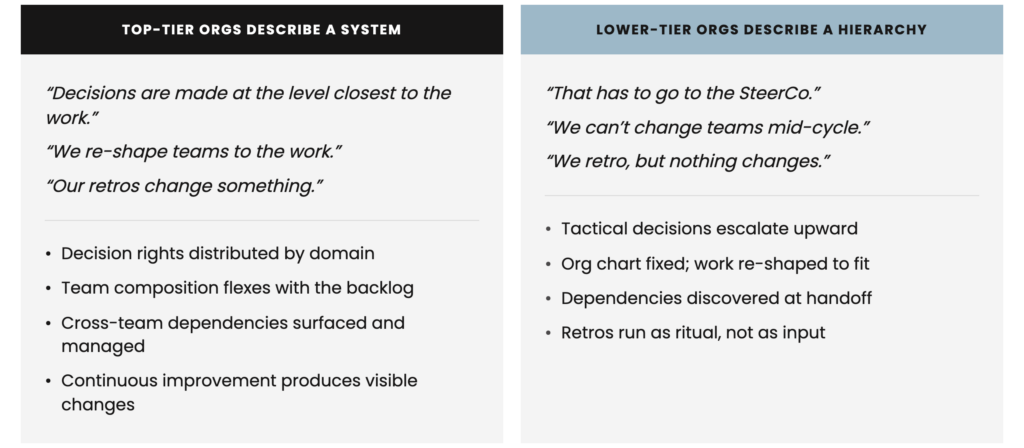
Top-tier organizations describe a system:
- “Decisions are made at the level closest to the work,”
- “We used to be organized in silos also...Now, we are breaking more or less those silos to integrate all the capacities in one single group,”
- “Our retros change something.”
This language corresponds to a system where decision rights are distributed, teams flex with the backlog, and cross-team coordination is effectively managed and turned into a strength.Lower-tier organizations describe a hierarchy:
- “We find ourselves a lot of time saying 'mother may I?' in a lot of these instances because we don't want to assume decision space,”
- “It's pretty rigid in terms of... the structure... because of the nature of our work,”
- “We talk, we talk, we talk a lot about this, but nothing changes.”
Meanwhile, this language corresponds to tactical decisions that escalate upward and a rigid organizational environment. Dependencies are treated as handoffs not collective value-stream problems and agile events where the team is just going through the motions without using it as an opportunity to drive change.
What Does This Means for Leadership?
Three implications follow for leadership:
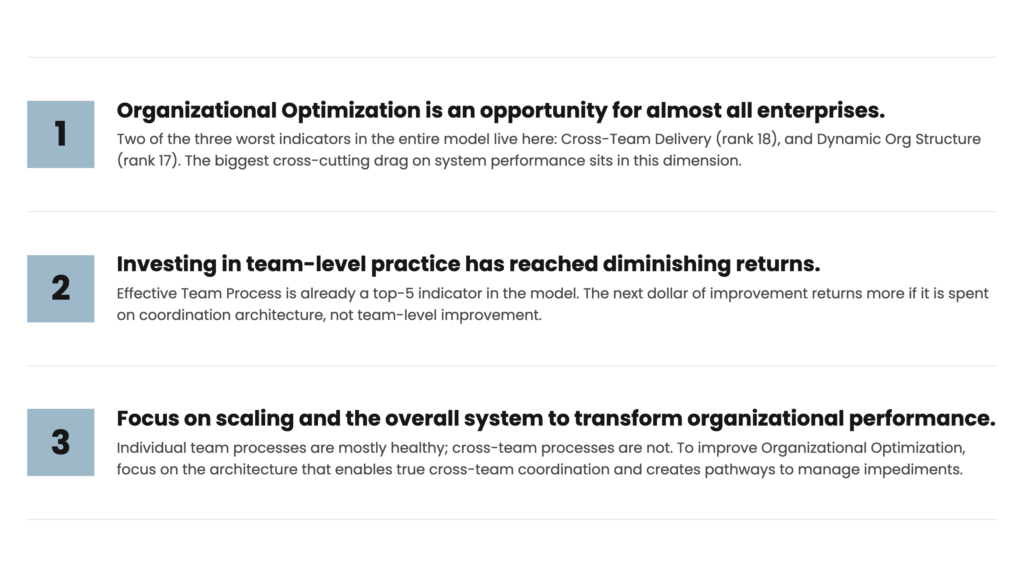
First, nearly all enterprises can improve Organizational Optimization. Only one organization had this dimension as its highest-scoring area. Two of the bottom three sub-dimensions sit in this dimension. There is opportunity for improvement across the board.
Second, the relative scores suggest prioritizing cross-team coordination and organizational adaptability: Effective Team Process already ranks 4th of 19 indicators. A number of organizations have already taken the first step to improve team performance through training and credentialing in agile ways of working. These findings support considering system-level improvements alongside team-specific investments.
Third, the biggest opportunity for organizations is investing in scaling architecture. Create the pathways that help dislodge bottlenecks and allow teams to truly coordinate. Scale to enable organizational agility.
Leaders have the ability to redefine the way they look at Organizational Optimization. Just as organizations apply product thinking to their customer-facing products, they can apply that same discipline to the design and continuous improvement of their operating model. The organization itself is a product that needs to evolve as priorities and conditions change.
Summary
Organizational Optimization presents the greatest opportunity to improve from an existing weakness to a source of strength and for tighter internal consistency. It is the dimension where the Agile Health Assessment shows the clearest structural limit on performance. Ninety percent of organizations score it below their average across the other four dimensions, and only one organization in the entire dataset has it as its strongest dimension.
However, that weakness isn't consistent across all aspects of Organizational Optimization. Effective Team Process ranks in the top 5 of all sub-dimensions and Dynamic Organization Structure and Cross-Team Delivery are in the bottom three. Team-level process scores are comparatively strong. The lower scores point to greater challenges in cross-team coordination and organizational adaptability.
Perception differences between leaders and teams and the three key patterns observed (i.e. Communication Silos, Capacity Constrained Trade-offs, and Centralized Decision Latency) tell a similar story. The issue is across teams, not within a team.
This brief points to scaling structures as the biggest lever to drive Organizational Optimization. Focus on improving the systems that turn dependencies into shared value-stream problems instead of hand-offs, distributed decision rights, and team structures that can flex with the work.
Focusing on these system-level changes will create the architecture that allows you to focus on your customers, deliver with speed, and maintain alignment on priorities throughout the organization. Optimizing your organization in this way creates the foundation for greater organizational and business agility, ultimately driving greater value.